Builders have the most unsold homes since 2009. These are the housing markets with deals
Builders have the most unsold homes since 2009. These are the housing markets with deals
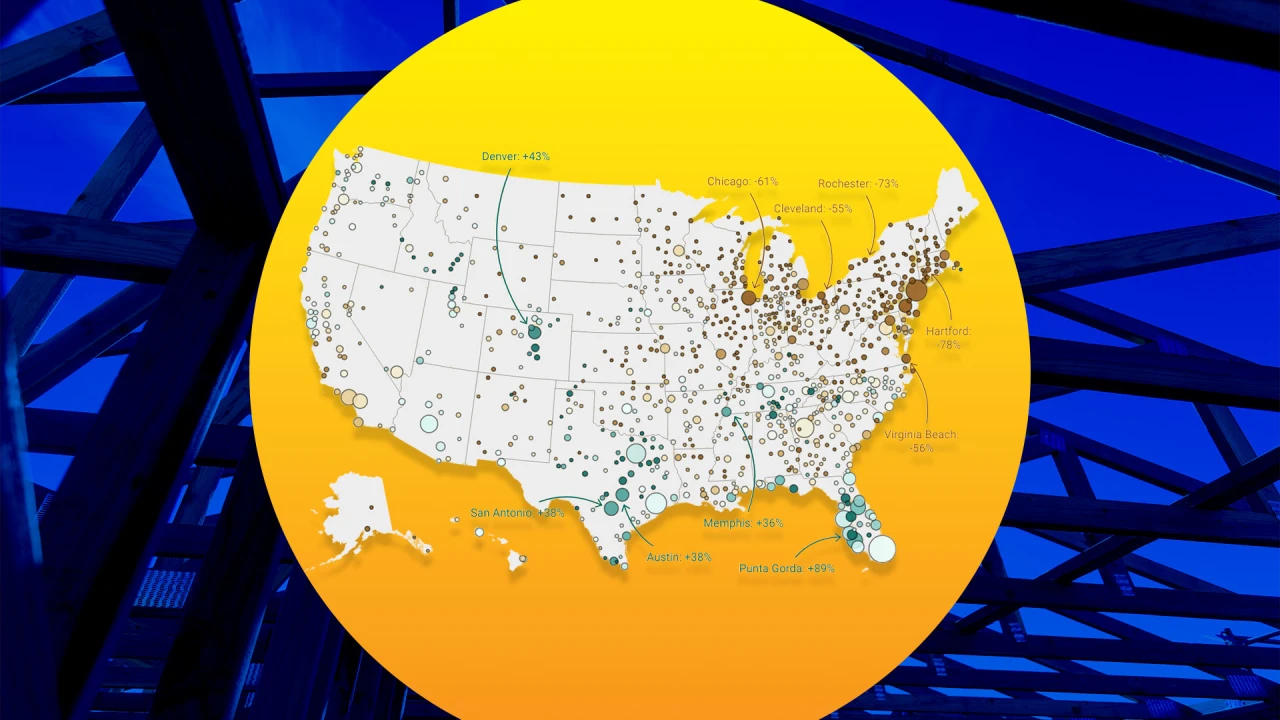
Want more housing market stories from Lance Lambert’s ResiClub in your inbox? Subscribe to the ResiClub newsletter. Speaking to investors earlier this month, D.R. Horton CEO Paul Romanowski said that the spring 2025 selling season for America’s-largest homebuilder is off to a slower-than-normal start. “This year’s spring selling season started slower than expected as potential homebuyers have been more cautious due to continued affordability constraints and declining consumer confidence,” Romanowski said on the company’s earnings call. It isn’t just D.R. Horton. “We do not see the seasonal pickup typically associated with the beginning of the spring selling season,” Lennar co-CEO Jon Jaffe told investors on March. “So we continue to lean into our machine focusing on converting leads and appointments and adjusting incentives as needed to maintain sales pace. These adjustments came in the form of mortgage rate buydowns, price reductions, and closing cost assistance.” Last quarter, Lennar spent the equivalent of 13% of home sales on buyer incentives—up from 1.5% in Q2 2022 at the height of the pandemic housing boom. A 13% incentive on a $400,000 home translates to $52,000 in incentives. This weaker housing demand environment is causing unsold inventory to tick up. Indeed, since the pandemic housing boom fizzled out, the number of unsold completed U.S. new single-family homes has been rising: March 2018: 62,000 March 2019: 77,000 March 2020: 76,000 March 2021: 34,000 March 2022: 32,000 March 2023: 70,000 March 2024: 89,000 March 2025: 119,000 The March 2025 figure (119,000 unsold completed new homes) published this month is the highest level since July 2009 (126,000). Let’s take a closer look at the data to better understand what this could mean. To put the number of unsold completed new single-family homes into historic context, we created a new index: ResiClub’s Finished Homes Supply Index. The index is one simple calculation: The number of unsold completed U.S. new single-family homes divided by the annualized rate of U.S. single-family housing starts. A higher index score indicates a softer national new construction market with greater supply slack, while a lower index score signifies a tighter new construction market with less supply slack. If you look at unsold completed single-family new builds as a share of single-family housing starts (see chart below), it still shows we’ve gained slack; however, it puts us closer to pre-pandemic 2019 levels than the Great Recession of 2007–2009. While the U.S. Census Bureau doesn’t give us a greater market-by-market breakdown on these unsold new builds, we have a good idea where they are based on total active inventory homes for sale (including existing homes) that have spiked above pre-pandemic 2019 levels. Most of those areas are in the Sun Belt around the Gulf. Builders are facing pricing pressure in some housing markets, especially in key Florida and Texas markets, where active inventory has jumped back above pre-pandemic 2019 levels. Big picture: There’s greater slack in the new construction market now than a few years ago, giving buyers some leverage in certain markets to negotiate better deals with homebuilders.


With Beyoncé's Grammy Wins, Black Women in Country Are Finally Getting Their Due
February 17, 2025
Bad Bunny's "Debí Tirar Más Fotos" Tells Puerto Rico's History
February 17, 2025


Comments 0